


In the last post we have covered static canvas elements. Now let's see how we can create dynamic ones. This post refers to this article.
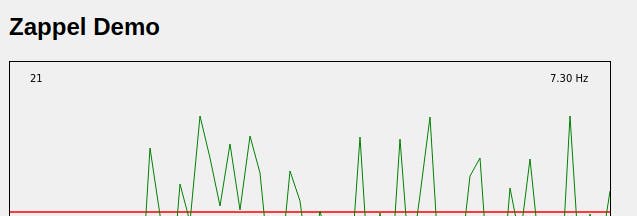
Before diving into the code, let's take a look at an example:
You can test it yourself here: picolisp.com/canvas
The zappel.l functionality
"zappeln" is a German word and means something like "fidgeting" in English, like a child that can't sit straight on its chair:

The graph in the example has no specific meaning, it's just "fidgeting" around randomly. There are two versions, a static one that renders on click, and a dynamic one that reloads regularly. We can set the speed and position with help of some buttons.
Let's go through the code step by step.
The basic program
The basics are simple: We load the libraries, define some global variables and functions:
(allowed () "!zappel" "@lib.css" )

(load "@lib/http.l" "@lib/xhtml.l" "@lib/form.l" "@lib/canvas.l")

(de *DX . 600)
(de *DY . 300)

(setq
   *DY/2 (/ *DY 2) )

(de drawCanvas (Id Dly)
   (make
      (csClearRect 0 0 *DX *DY)
      (csFillText *Value 20 20)
      (csStrokeStyle "red")
      (csStrokeLine 0 *DY/2 *DX *DY/2)

(de zappel ()
   (and (app) *Port% (redirect (baseHRef) *SesId *Url))
   (action
      (html 0 "Zappel" '("@lib.css" . "canvas {border: 1px solid}") NIL
         (form NIL
            (<h2> NIL "Zappel Demo")
                  (<canvas> "$single" *DX *DY)
                  (javascript NIL "onload=drawCanvas('$single', -2)") ) ) ) )

(de go ()
   (server 8080 "!zappel") )
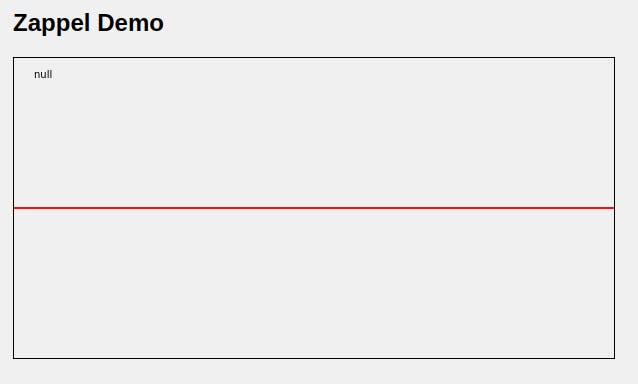
Note: (de *DX . 600) is basically the same as (setq *DX 600), except that it raises a warning if *DX already has a (non-NIL) value, and you can check its source code with vi '*DX from the REPL.
Also, we set to `(/ *DY 2) to *DY/2 for the sake of better readability (/ is not reserved in PicoLisp).
Result is this:
Defining the graph *Plot
Now we have the basic canvas where we can draw our plot. Let's say we want to draw a graph where all points are at 10 px distance from each other. For our 600 px canvas it means 60 points.
We can initialize those variables in a global variable *Plot in a main function:
(setq *DX/10 (/ *DX 10))

(de main ()
   (do (inc *DX/10)
      (fifo '*Plot NIL) )
Now we have a fifo list *Plot of length 60, all initilaized with NIL.
Also let's add a button Step which adds a new point to our *Plot and redraws the canvas afterwards. We can execute JavaScript code with the +onClick Prefix Class (here you can find more on +onClick):
(<canvas> "$single" *DX *DY)
(javascript NIL "onload=drawCanvas('$single', -2)")
(gui '(+OnClick +Button)
   "return drawCanvas('$single', -1)"
   "Step" ) ) )
Note that we call drawCanvas with a delay=-2 in the first onload, but with delay=-1 in the second one. Why do we do that? In general, both have the same effect - for a delay <0, the canvas content is only drawn once instead of automatic redraw.
However, we can use the difference in delay in our drawCanvas function, as we will see now.
Setting the plot points
Next, we add a random value to *Plot each time the "Step"-button is pressed. It is added as first value to the plot.
(de drawCanvas (Id Dly)
   (when (>= Dly -1)
      (set *Plot
         (- *DY *DY/2 (setq *Value (- (rand 0 200) 100))) )
      (++ *Plot) )
   (make
      ...
set adds a random value between -100 and +100 to the *Plot, and ++ *Plot returns this value and moves it to the tail of the list. For example, if we press the Step-Button two times, *Plot will be at (NIL NIL ... value2 value1).
Next, we draw *Plot.
- First, we set the stroke style to "green".
- Then we utilize the JavaScript beginPath function, which draws a line between two points that are defined with
moveToandlineTo.
(de drawCanvas (Id Dly)
   ...
   (make
      ...
      (csStrokeStyle "green")
      (csBeginPath)
      (let Y1 (++ *Plot)
         (and Y1 (csMoveTo 0 ))
         (for X *DX/10
            (let Y2 (++ *Plot)
               (if2 Y2 Y1
                  (csLineTo (* X 10) Y2)
                  (csMoveTo (* X 10) Y2) )
               (setq Y1 Y2) ) ) )
      (csStroke) ) )
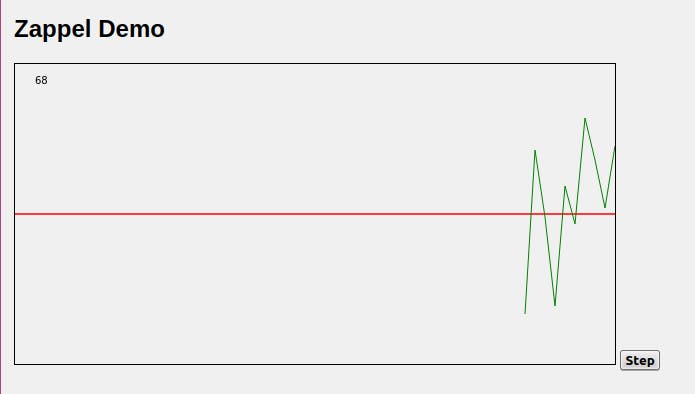
What is happening? We move over the *Plot list and set Y1 and Y2 to consecutive plot points. If both of them are non-NIL, we draw a green line between them, otherwise we push them to the back and continue with the next one.
The result looks like this:
Adding *Offset
Next, we add the "Offset": until now the values evolved around the red line which was placed exactly in the middle. Now we will add a global *Offset variable which can be increased and decreased by 10 pixels by using buttons. In the main function, we initialize *Offset to zero.
(gui '(+Able +Button) '(n0 *Offset) "Pos = 0" '(zero *Offset))
(gui '(+Button) "++ Pos" '(inc '*Offset 10))
(gui '(+Button) "-- Pos" '(dec '*Offset 10))

...

(de main()
   ...
   (zero *Offset))
Next we modify our drawCanvas and move all Y2 and Y1 byt the current *Offset:
(let Y1 (++ *Plot)
   (and Y1 (csMoveTo 0 )) (- @ *Offset)))
   (for X *DX/10
      (let Y2 (- (++ *Plot) *Offset)
Now we can shift the whole graph up and down if the respective button is pressed.
Adding the "Frequency"
Let's another variable to our graph: the frequency, i. e. how many plots per second were created.
The usec function returns the time since interpreter startup in microseconds. We create a local variable U where we store it, and another variable D ("difference") which stores the last refresh:
(let (U (usec) D (- U (default *Last U)))
Now in order to calculate the frequency, we calculate how many frames were updated within one second (= 1 million microseconds). From the number of frames and the difference D we can calculate the frequency in Hertz:
(inc '*Frames)
(when (>= D 1000000)
   (setq *Hz (*/ 100000000 *Frames D)  *Last U  *Frames 0) )
Note: PicoLisp uses fixed point arithmetics for calculation.
Then we print the output with two decimal digits at position 60, 20:
(csFillText (pack (format *Hz 2) " Hz")
   (- *DX 60)
   20 ) )
Adding automatic refresh
Until now, our graph only updates when we press the button. Now let's create an alternative view that updates automatically.
The good news is that we don't need to modify anything in our drawCanvas function; the only difference is in our zappel function where we define the HTML.
First of all we create two tabs with the <tab> function which takes a list of commands as arguments, where the first one can be a string with the tab title:
(<tab>
   ("Zappel"
      ...)
   ("Single"
      (<canvas> "$single" *DX *DY)
      (javascript NIL "onload=drawCanvas('$single', -2)")
       ...
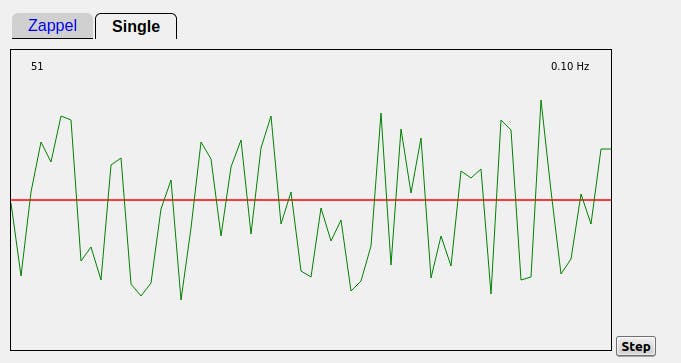
Instead of a negative delay value, we set a positive delay value in milliseconds. Let's create a global variable *Delay and initialize it to any value:
(setq *Delay 256
Then we pass *Delay to our canvas. On top we also add two buttons to modify the delay value:
(<canvas> "$zappel" *DX *DY)
(javascript NIL "onload=drawCanvas('$zappel', " *Delay ")")
(gui '(+Able +Button) '(> *Delay 1) "Faster" '(setq *Delay (>> 1 *Delay)) )
(gui '(+Button) "Slower" '(setq *Delay (>> -1 *Delay)))
With this minor modification, the graph now updates periodically.
You can find the source code of this example here.
Sources
irasutoya.com/2019/09/blog-post_35.html
picolisp.com/wiki/?canvasDrawing
picolisp.com/wiki/?OnClickButton