


In the last post, we have seen that we can use the "standard" PicoLisp <table> function to display output from the database. The advantage is that it's a standardized and powerful with very concise code.
But we don't want to be restricted to tables, so let's try an alternative way which builds up on the "responsive" layout from this post. In the end, it will look like this:

The Goal
Previously we created a very simple app, where the only functionality is adding and deleting items.
Unfortunately, our design had a serious flaw: Everytime we modified anything, the whole page was reloaded. This can be a problem when we are handling huge amounts of data.
So our target now is:
- add a database to our Todo-App,
- display the data in a flexible, yet efficient way.
Adding the database
First of all, we add the database like described in the previous post: Wrap the HML-output into a todo-list function which we add to go- and allow, and a main function to open the database. Also, we load all the libaries and define the database.
The database is also the same like in the last post except for the color attribute. Since we're not planning a "search-by-color" function, we don't add an index class.
# Database
(class +Todo +Entity)
(rel dat (+Ref +Date))                 # Date
(rel item (+IdxFold +String))          # Item
(rel color (+String))                  # Color
Adding new items
Then we add the "Add new item" section in separate fields. Instead of the RGB-Picker, let's use a dropdown menu to define the color.
(form NIL
   (gui '(+Cue +TextField) "Thing to do" 30 ) )
   (gui '(+Cue +DateField) "Enter a date" 10 ) )
   (gui '(+TextField) '("black" "red" "green" "yellow" "blue"))
   (gui '(+Style +Button) "button-icon" T "img/plus.png"
      '(prog
         (addToDatabase (val> (field -3)) (val> (field -2)) (val> (field -1)))
         (init> (: home query)) ) )
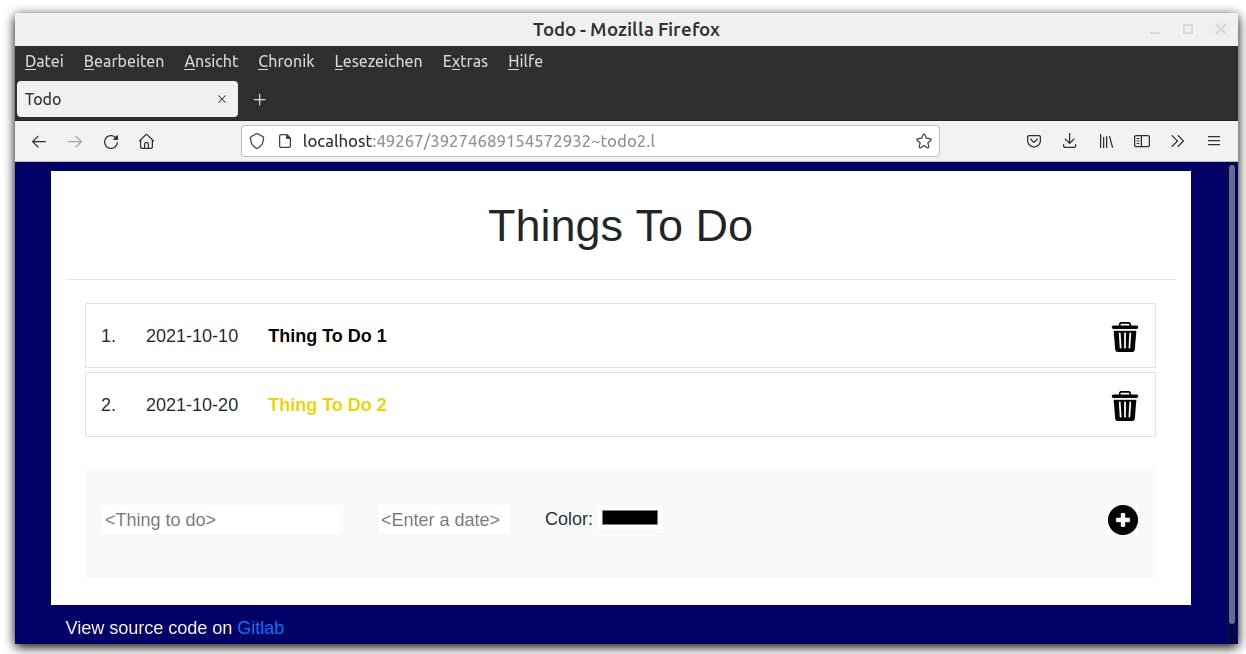
With a little bit of styling, it looks like this:

The add button executes the two functions addToDatabase and init>, causing a reload of the query data. addToDatabase is defined as:
(de addToDatabase (Item Date Color)
   (new! '(+Todo)
      'item Item
      'dat Date
      'color Color ) )
The function new! is automatically adding +Todo objects to the database. Then (init> (: home query)) is executed, which automatically adds the new item to our chart. query is the name of +QueryChart GUI component that contains all the database results. We will define that one now.
The +QueryChart component
First of all, we define the Pilog query which is almost identical to the previous post except that we set @Dat and @Item to fixed values:
(gui 'query '(+QueryChart) 4
   '(goal
      (quote
         @Dat (cons NIL T)
         @Item ""
         (select (@@)
            ((dat +Todo @Dat) (item +Todo @Item))
            (range @Dat @@ dat)
            (part @Item @@ item) ) ) )
@Dat (cons NIL T) can be read as: "range from the smallest possible to the largest possible date", which is true for all (non-empty) dates. Likewise, "" is a substring of all possible strings. In other words, with this query we return all legal items from the database.
Then we define the put function. We have three columns per item in our output: date, item description (colored) and the delete button. Also, we want three output values: date, item and color.
3
'((This) (list (: dat) (: item) (: color)))
With this, we technically allocate color to the delete button (which doesn't need it), although we plan to use it on the "item" column. Maybe a little bit dirty, but it works.
We don't need a get for our +QueryChart function because the output should not be editable.
Displaying the data
Then we can take this data to display it in a doloop. The value is 4 because we defined 4 rows in our query chart (the first argument). Then we define gui 1, gui 2 and gui 3.
(do 4
   (gui 1 '(+DateField))
   (gui 2 '(+Style +TextField)
      '(pack  (curr 'color) " text-capitalize font-weight-bold col"))
   (gui 3 '(+Style +JS +Able +Button) "button-icon mb-3"
      '(nth (: chart 1 data) (row))
      T "img/delete.png"
      '(prog
         (lose!> (curr))
         (init> (: home query)) ) ) )
Setting the color
Let's take a look at the gui 2element. It gets the "color attribute of the current object" (curr 'color) and assigns it to the prefix class +Style.
+Style only lets us define class names, which means that we cannot assign the style-value directly (like style: text-color="red"). Fortunately, the classes "red", "green", "blue", "yellow" are already included in lib.css, so we don't need to do anything further:
# <lib.css>

.black {color: black}
.white {color: white}
.red {color: red}
.green {color: green}
.blue {color: blue}
.yellow {color: yellow}
Deleting rows
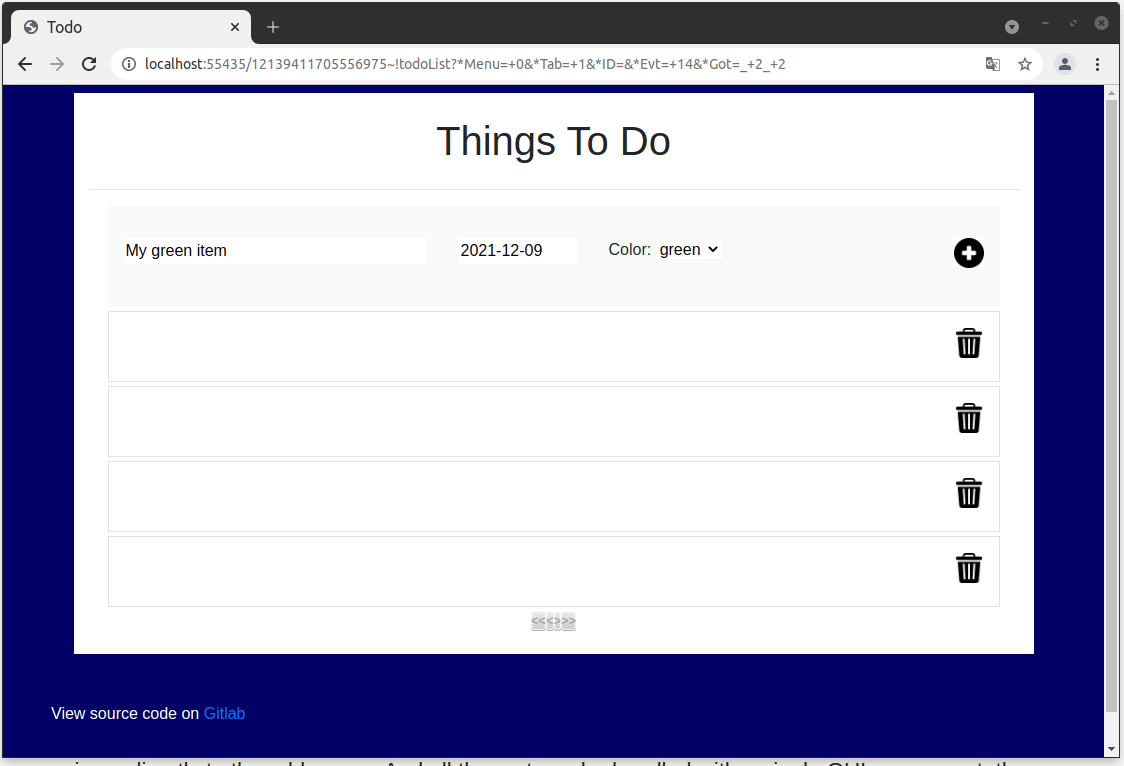
We could have used the built-in button +DelRowButton to delete items, but then the design would have been fixed. So let's define our one instead:
- It is enabled if the current row contains data (
'(nth (: chart 1 data) (row))). - The contained database object is removed using the
lose!>method, - then the
queryGUI element is redrawn. These two actions happen in the background purely in JavaScript, the page is not fully reloaded.
This is the code:
(gui 3 '(+Style +JS +Able +Button)
   "button-icon mb-3"
   '(nth (: chart 1 data) (row))
   T "img/delete.png"
   '(prog
      (lose!> (curr))
      (init> (: home query)) ) )
The finished layout
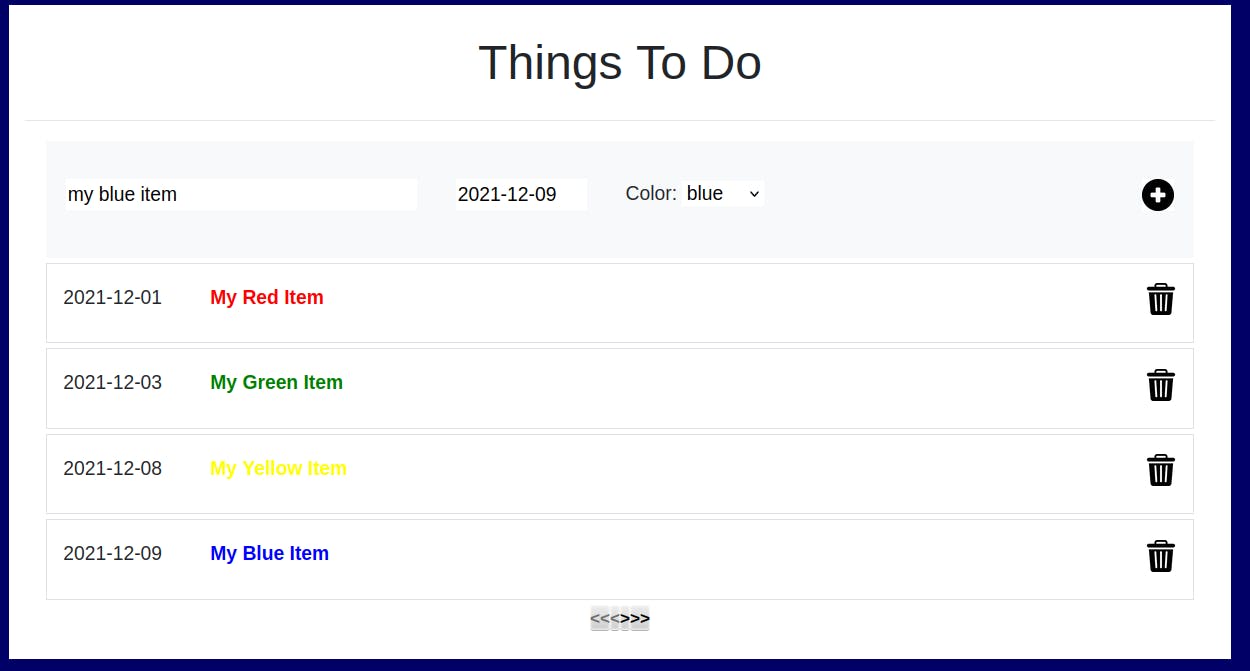
It almost looks like the previous version, but there is one difference: The number of displayed items is fixed (in our example: always 4). We cannot increase or shorten this dynamically because this required a full page reload. In the end, it looks like this:
Next steps
Next we will add a little user management to our app. The user can only display and edit the data after logging in. And lastly, we will show how we can create APIs to get, delete and modify data with command-line tools like CURL.
The source code of this example can be downloaded here.
Sources
software-lab.de/doc/index.html
software-lab.de/doc/form/form.html